The New Way to Visualise and Analyse Environmental Data

by Jess Parry

Our Environmental Sensors provide unmatched visibility into the environment for thousands of our customers. In a wide variety of ways, environmental sensors have enabled our customers to better understand and manage their environments, whether monitoring the air quality in a building or ensuring IDF closets don’t overheat.

As more sensors are deployed into buildings, all customer questions have been answered and delivered. Without this latest technology, our customers are able to view, analyse, and publicly showcase data from every environment.

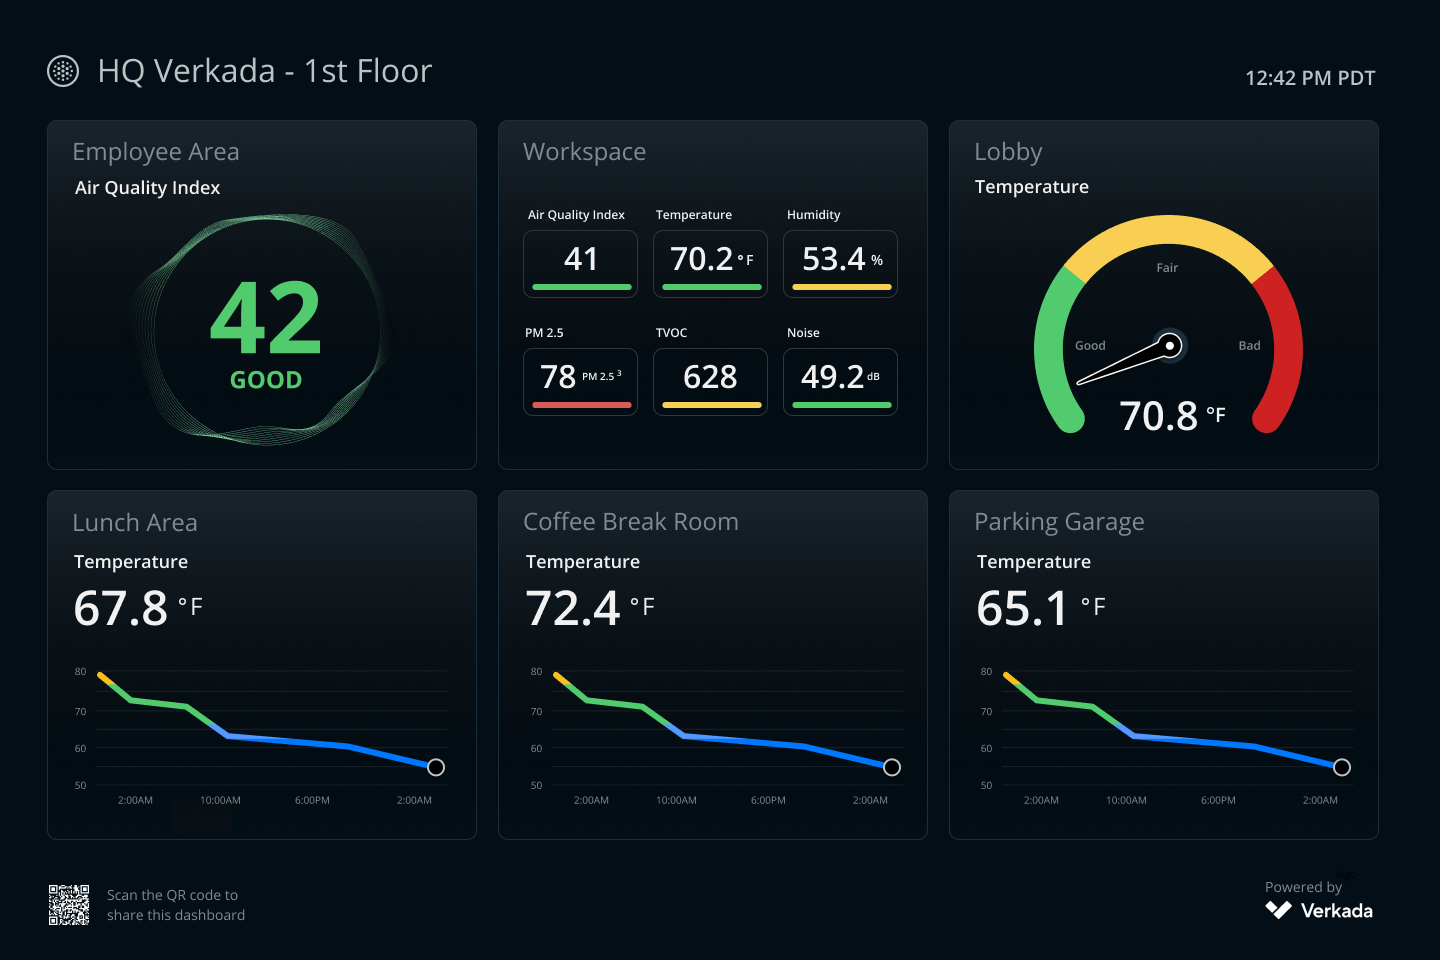
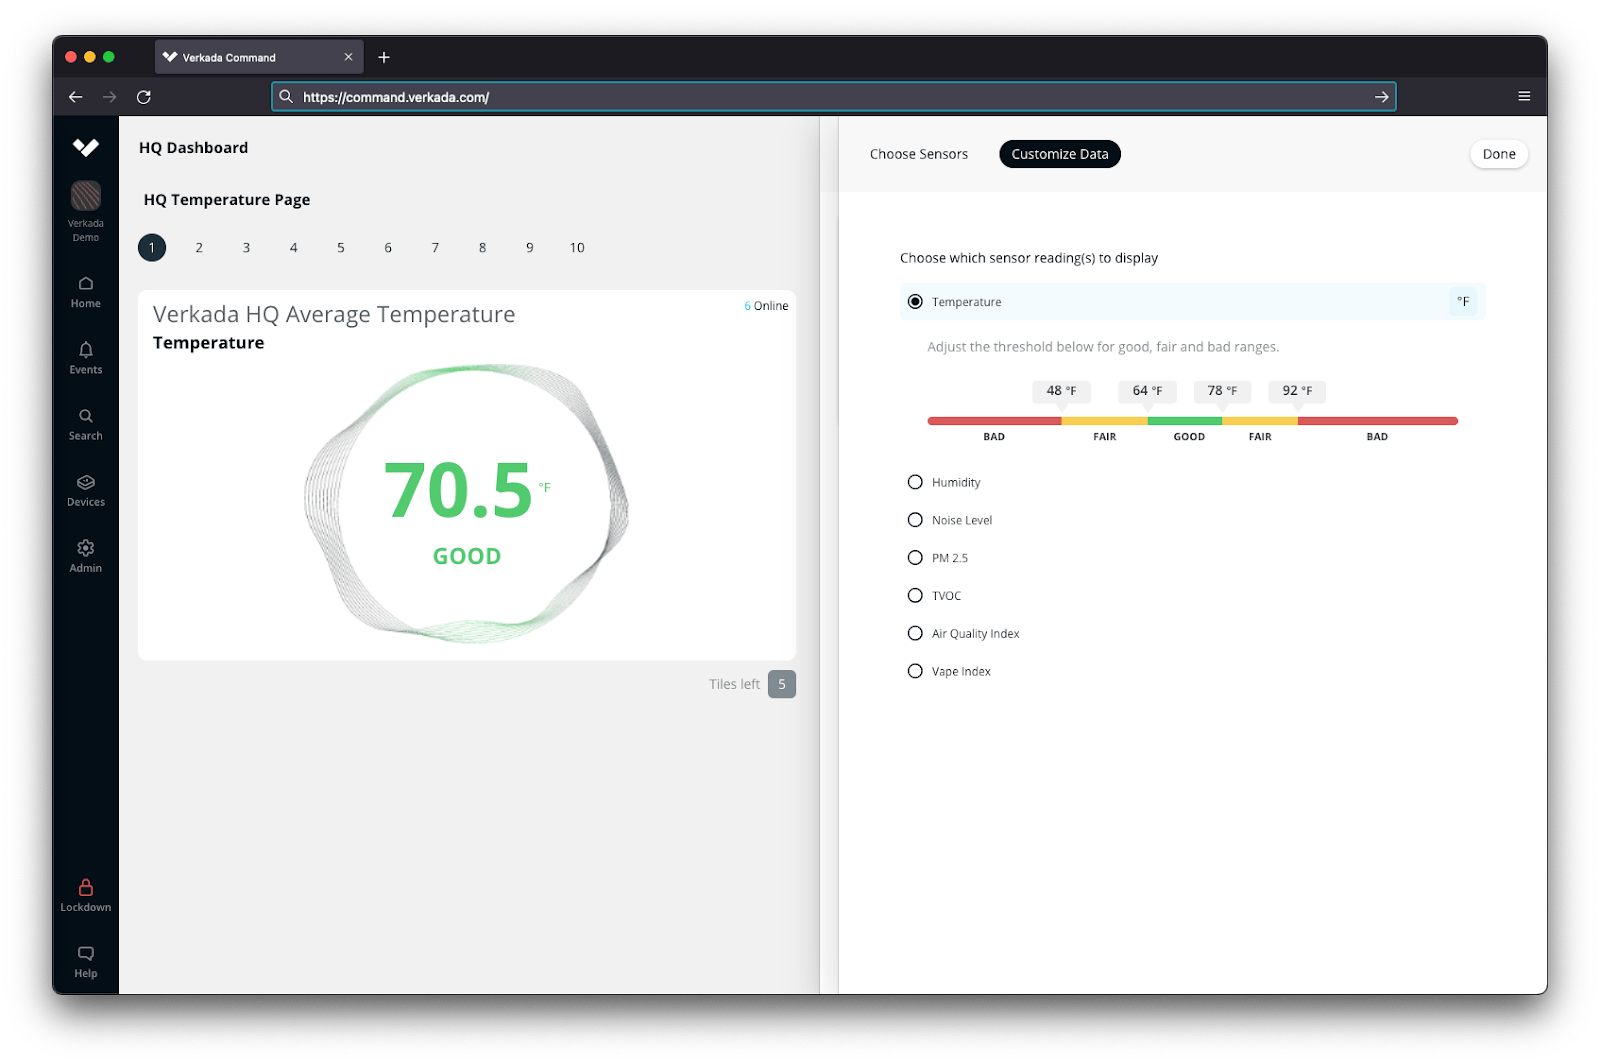
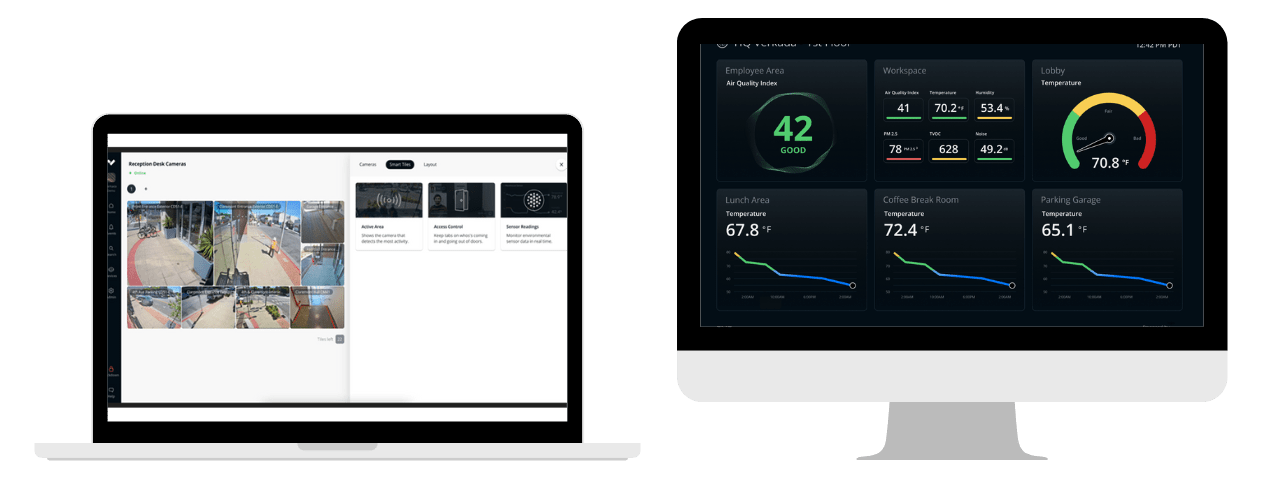
We’re happy to announce our Environmental Sensor Dashboards, a new way for our customers to easily customise, view, analyse, and display data across all of their sensors.

These dashboards allow our customers to get a unified view of their environment across multiple sensors and multiple sensor readings.

Aggregate and Visualise Data with Custom Tiles

We’ve created multiple Sensor ‘Tiles’ that allow our customers to aggregate and visualise different types of data:

  • The Metric Tile allows customers to aggregate readings across multiple sensors and display them as an average. This is a great way to showcase indoor air quality, for example, across a floor, a building, or a classroom.
  • The Gauge Tile also aggregates data across multiple sensors, but allows customers to show the value based on a scale.
  • The Sensor Readings Tile allows customers to easily view multiple data points at once from a single sensor, such as temperature, humidity, and noise.
  • The Line Graph Tile gives customers a way to view the last 24 hours’ worth of data for a particular sensor reading. This is a great way to see historical trends – such as temperature over the last 24 hours – at a glance.

With such a diverse customer base, this means we have to cover different needs when it comes to data display, and Dashboards provide maximum flexibility. Customers can combine relevant Tiles into pages within a Dashboard, which will automatically cycle through in Command or on a display screen. Customers are able to name their Dashboards, Pages, and Sensor Tiles, and can set thresholds for each Tile based on their unique environment.

Made for the Big Screen

The Dashboard has been designed with a big screen in mind. Customers can connect a large display to their computer and use the ‘Live View’ to publicly showcase their dashboard. Employees, visitors, and more will be able to see important environmental factors such as temperature, humidity, and indoor air quality as they enter the building.

This is the first step of many to give our customers a better way to visualise, analyse, and display their environmental data. Support has also recently been released for our Environmental Sensors on Floorplans to provide spatial context for their environment.

Learn More

Have we peaked your interest?? For more information all about about Dashboards and our innovative Environmental Sensors, get in touch with out team today. We’ll provide you with a free demonstration and arrange for a 30-day free trial.

Our Values

Approachable | Dedicated | Accountable | Professional | Trustworthy

Error: Embedded data could not be displayed.

This will close in 0 seconds

New Support Ticket

This will close in 20 seconds

UK IT Networks