Approachable | Dedicated | Accountable | Professional | Trustworthy
We are excited to announce a new cutting-edge capability for Verkada’s People Analytics suite; Occupancy Trends. Leveraging line crossing technology, Occupancy Trends allows users to determine the busiest times for a given space and analyse how foot traffic changes throughout the day.
How does it work?
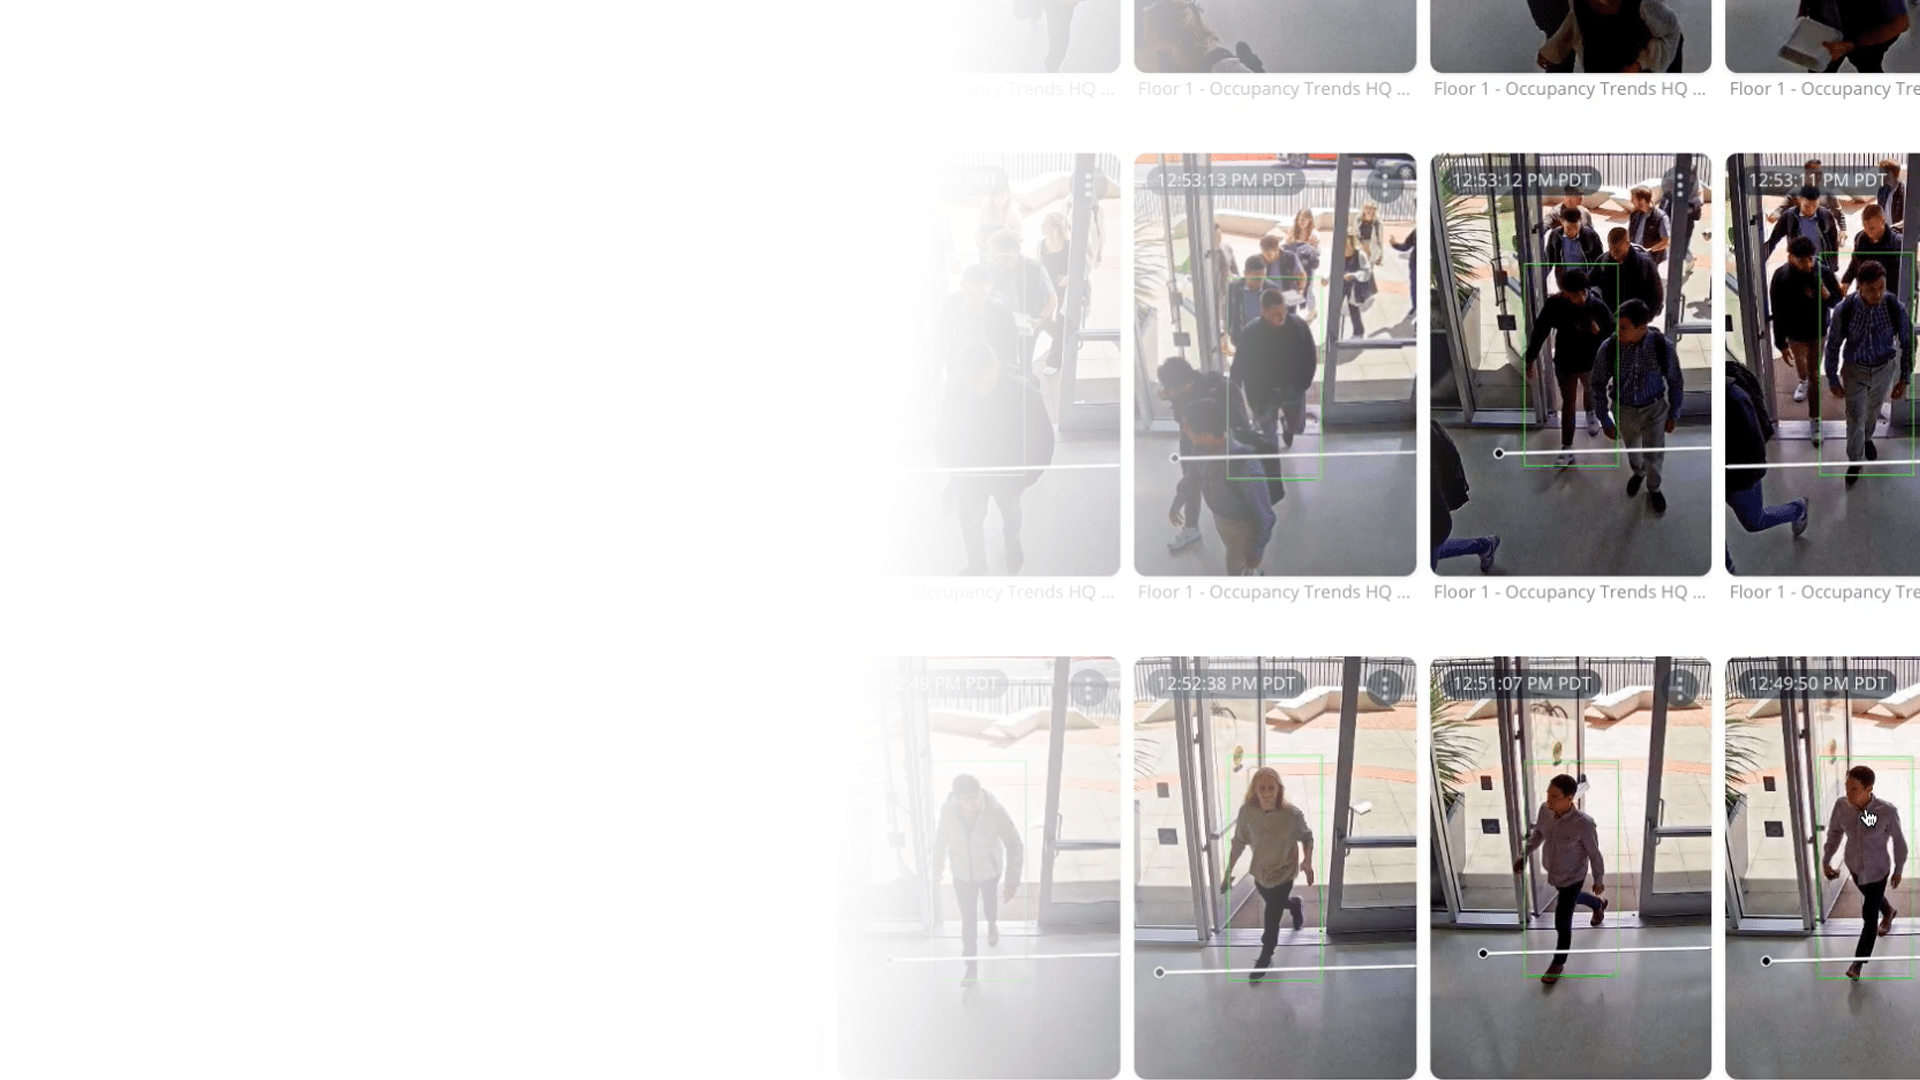
Each time a person is detected by a camera, we track their trajectory on the video feed and identify when their path crosses a digital line. We then display on a graph how many times we detected people crossing the digital line.
Getting Started
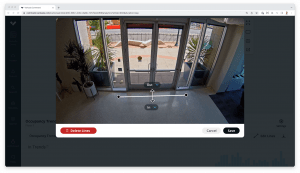
To set up Occupancy Trends, users first need to enable “People History” on the camera. After this, users can then navigate to the Analytics tab. If this is the first time that a user is creating a digital line, the user is presented with the button “+ Add Lines”. Clicking on this button will open the line editing screen. Clicking and dragging the cursor across the video feed establishes the digital line. Once the line is created, users can select “In” and “Out” directions (or “Ignore”) based on how people will be counted (or not counted) as they cross the digital line. Users can draw as many lines as needed on the screen. After clicking “Save”, the camera begins gathering Occupancy Trends data. At any time, users can click “Edit Lines” to edit the digital lines.
Interpreting the Data
All data for a camera, even for multiple lines, is aggregated into two graphs: “In Trends” or “Out Trends” in the Analytics tab. We store Occupancy Trend data for 365 days; users can filter down to months, weeks, or days. When hovering on a bar, a tooltip will display the number of people that our system detected. Clicking on the bar will display snapshots of detected people that crossed the virtual line and that we use to estimate Occupancy Trends. The detected people and associated thumbnails will only be available for the retention of the camera itself.
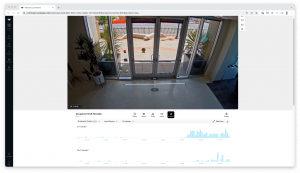
Data gathered through Occupancy Trends can be exported via CSV and will reflect the granularity of the toggle selection for the graph. Users can analyze the Occupancy Trend data against 3rd party data gathered through other applications to uncover deeper insights.
Key Use Cases
For anyone monitoring the occupancy of a space open to the public, Occupancy Trends provide valuable insights for optimizing staffing, adjusting hours of operation, and/or tracking the performance of marketing and promotional activities.
Retail, Financial Institutions, and Restaurants
With Occupancy Trends displayed over time, corporate and regional managers can analyse the data to benchmark the performance of a location, adjust staffing, and optimize hours of operation. Likewise, brand managers and strategy teams have actionable data to determine where they should offer promotions to attract more customers and increase sales.
Schools, Offices, and Infrastructure
In buildings that see varied traffic, understanding usage is also valuable in determining whether to further invest in additional space or downsize. With the increase of remote students and workers, facilities managers need data to justify the hours that they keep a location open and if the location is needed. With Occupancy Trends, facilities managers can effectively plan to secure additional space or close locations for efficiency.
Like any analytics feature offered by Verkada, Occupancy Trends are included with your camera license subscription. If you’re interested in learning more about how Verkada can help your organization detect people traffic, please contact our team at enquiries@ukitnetworks.com.